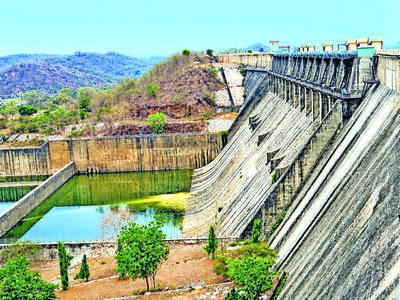
Nagpur: The threat of water scarcity is looming over Nagpur, with live storage in Totladoh reservoir , a key source of the city’s drinking water, plunging to just 25.33% of its designed capacity on Wednesday. The reservoir now holds barely 28% of the live water stock recorded on the same date last year, raising concerns over the city’s water security ahead of summer.
According to the latest water storage report, Totladoh had 257.61 million cubic metres (MCM) of live water against its designed capacity of 1,016.93 MCM on Nov 11. On the corresponding date last year, live storage stood at 89.50%, or around 910 MCM — a decline of 64.17 percentage points in a year.
Including 150 MCM of dead storage, the reservoir’s gross storage stood at 407.61 MCM against its total designed capacity of 1,166.93 MCM.
Nagpur currently has a combined water treatment capacity of 786 million litres per day (MLD) across five plants. Four of these are linked to the Pench system — Pench-1 (136 MLD), Pench-2 (175 MLD), Pench-3 (120 MLD) and Pench-4 (115 MLD) — with a combined capacity of 546 MLD. The Kanhan treatment plant accounts for the remaining 240 MLD.
Meanwhile, Kamthi Khairy reservoir , another key water source in the district, had 113.72 MCM of live storage against its designed capacity of 141.98 MCM, or 80.10%. This was lower than the 85.49% recorded on Nov 11 last year.
Among other reservoirs, Khindsi had 35.48% live storage, Nand 61.38% and Wadgaon 49.60%.
The sharp depletion at Totladoh assumes significance amid prevailing drought conditions and the Nagpur Municipal Corporation’s (NMC) efforts to strengthen water conservation. The civic administration has been exploring measures to curb distribution losses, plug leakages and promote the reuse of treated sewage water to reduce dependence on freshwater sources.
NAGPUR’S WATER TREATMENT CAPACITY
WTP --Capacity
Kanhan--240 MLD
Pench-1--136 MLD
Pench-2--175 MLD
Pench-3--120 MLD
Pench-4--115 MLD
Total--786 MLD
RESERVOIR STORAGE ON NOV 11
Totladoh: 25.33% | Last year: 89.50%
Kamthi Khairy: 80.10% | Last year: 85.49%
Khindsi: 35.48% | Last year: 99.53%
Nand: 61.38% | Last year: 100%
Wadgaon: 49.60% | Last year: 100%
Figures indicate live storage as a percentage of designed live storage capacity.
Contact to : xlf550402@gmail.com
Copyright © boyuanhulian 2020 - 2023. All Right Reserved.